Reading Your LeadGen Compass Monthly Report

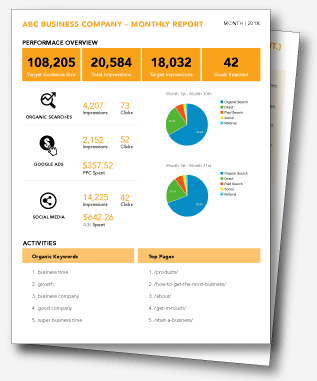
The LeadGen Compass Monthly Report is designed to help you stay on top of your online marketing. Our guide to reading your LeadGen Compass Monthly Report will help you understand the report so you can help us calibrate your marketing and get better results from your lead generation strategy.
The Performance Overview Section
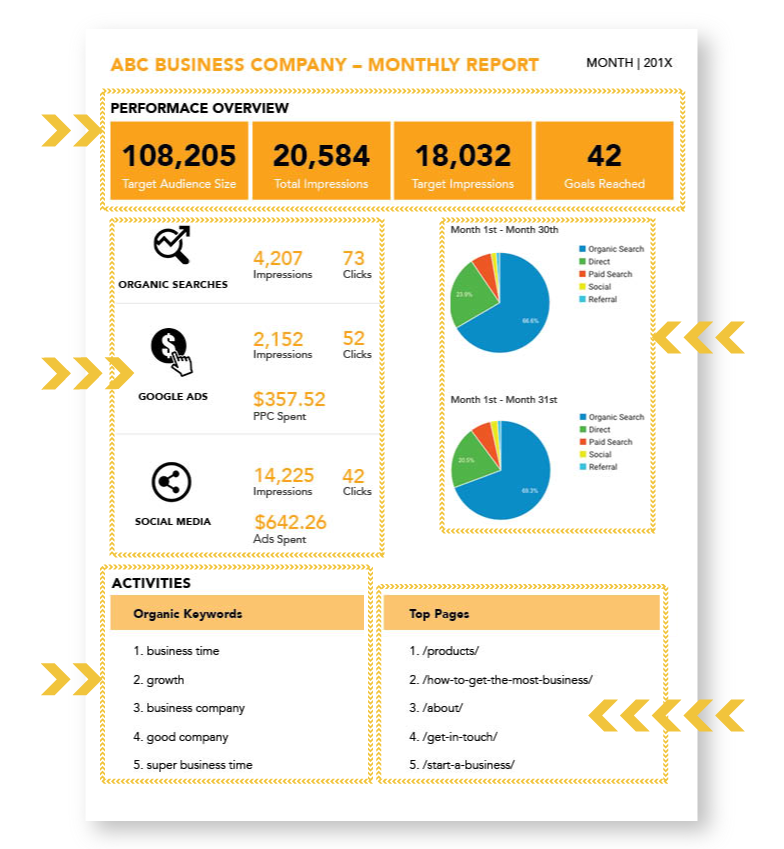
This section contains a monthly snapshot of your target audience, total impressions, target impressions, and goals reached.

Traffic Breakdown Section
In this section the major sources of your website traffic are segmented for further analysis.

Organic Keywords Section
The past month’s organic search terms are posted here.

1
2
3
4
5
The LeadGen Compass Monthly Report First Page
1

The Performance Overview Section

Target Audience Size: Your target prospect audience. For instance, Property Managers or Facility Managers in downtown Houston, TX.
Total Impressions: The number of times your website showed up in search engines, social media, etc. This number includes paid or organic impressions.
Target Impressions: The number of the total impressions that were from your target market. For instance, impressions from downtown Houston, TX.
Goals reached: A goal is an action you want your target audience to take. Examples include website forms, click to calls, downloaded materials or key web page views like a price page.
2

Traffic Breakdown Section


The main website traffic sources we focus on are Organic Search Engine traffic, Google Ad traffic, and Social Media traffic. Google represents 80%+ of the traffic we track, so we’re particularly interested in the raw numbers each month.

3

Organic Keywords Section


Your search engine activity will be broad and deep, but we report the top five keywords driving your activity. The more these top five terms represent phrases your prospective customers use, the better the lead generation.

4

Web Traffic Breakdown Section


When you look at the sources of your website traffic over the last two months, it allows you to do a quick comparison and ask questions like “why is direct traffic so much bigger than search engine traffic this month?” Those conversations with your account executive lead to insights we can use to find more sales leads.

5

Top Web Pages Section


Your search engine activity is more than keyword phrases. We watch the top pages your traffic visits and how they relate to your top organic keywords. Taken together, they tell a little story about the audience on your website and what kind of information they want from your website. These reports give us content ideas and help your sales team.
Web Traffic Breakdown Section
This section looks at the last two months activity on your website, broken down by Organic Search Engine, Direct, Paid, Social Media, and Referral traffic.

Top Web Pages Section
This section shows which of your website’s pages were visited most.

Goals Completed Section
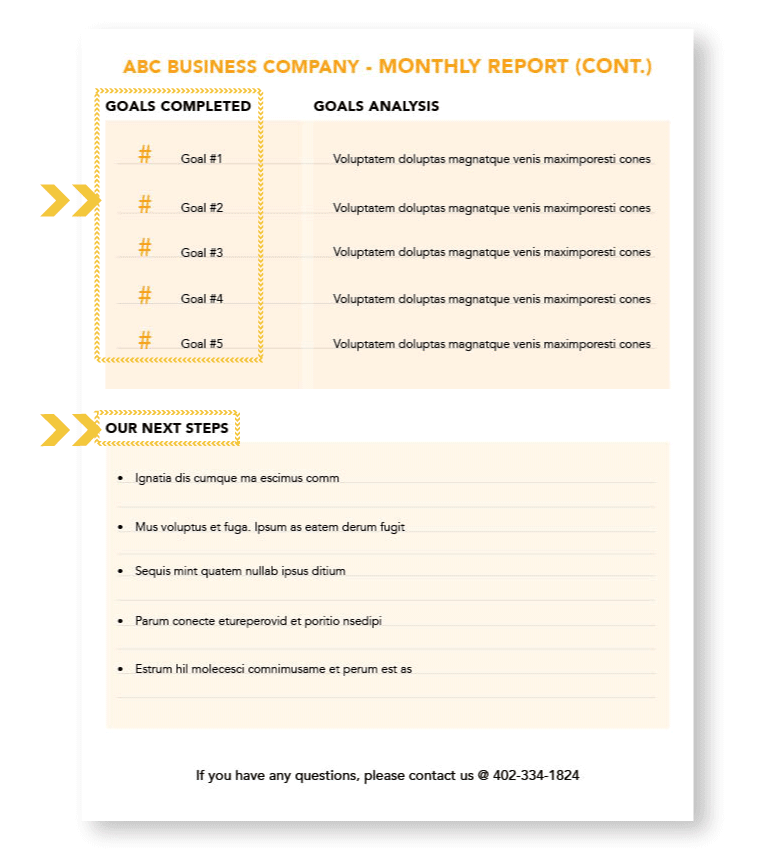
In this section we list the goals that were achieved throughout the month.

Our Next Steps Section
In this section we outline actions we will be focusing on in the next month.

1
2
the LeadGen Compass Monthly Report Second Page
1

Goals Completed Section

The goals come from your conversations with your account executive and they are reported here. For non-ecommerce businesses, many of the goalslisted are Leading Indicators of actions your best prospects will take. For example, a good prospect may visit both the About Us and Pricing pages in the same session. Or it may be something more direct like a click-to-call from a pay-per-click ad that results in a call over 1 minute long.
2

Our Next Steps Section


This section lists what our team thinks the priorities should be for the coming month. Out customer love this section but probably not for the reason you think. They love it because it’s a place where they can disagree with our plan. When there is a disagreement, it gets us closer to generating your best sales leads.